Solar farm site screening using DataHive GIS data

Automated GIS data for faster solar site location selection
DataHive × LUUCY Partnerschaft
Efficient analysis of potential solar sites by screening across multiple GIS sources.
Automated aggregation and cleaning fragmented public geodata.
Keeps location inputs updated to reduce outdated decisions.
Key challenges

Analysis of fragmented GIS inputs is inefficient and prone to errors.

Customer builds solar farms in the USA and manually collects and analyses scattered site data from many geoinformation sources.
1

Too many factors limit the depth of a manual site analysis

Think network capacity, flood zones, terrain slope, distance to critical- and electrical grid infrastructures, and more.
1

Data is scattered across sources

Public data exists, but it is spread across many source systems and formats.
1

Manual work is inefficient

Manual collection is slow and error-prone.
1

Data gets outdated, challenging to see the larger picture.

Network capacity changes often; stale data can drive wrong investments.
Solution Framework

Automated screening with DataHive GIS services

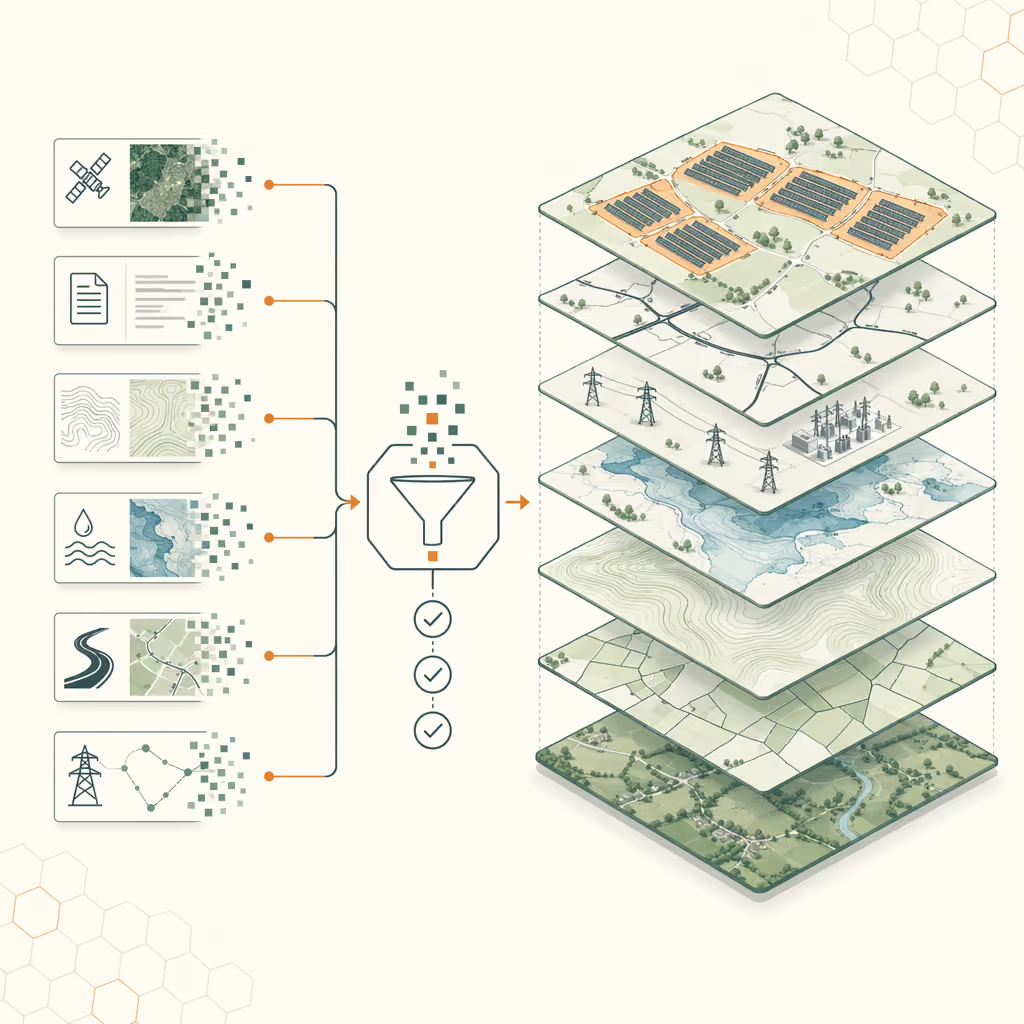
We automate data extraction, filtering, and GIS delivery.
Contact an expert

Geospatial rocessing

Including raster and vector processing to combine terrain models with cadastre data to assess slope, exposure, and soil conditions. 

Topology-based assessment of economical feasibility

using distance to feeder lines / substations to assess access and connection costs, and parcels to grid infrastructure to identify protection rules or risks.

Continuous delivery of automated data extracts.

Consolidate geodata from portals, GIS platforms, and databases. Clean, up-to-date, directly into ArcGIS, QGIS, and more.

KPI-based filtering prior to investing resources

Filtering of parcels possible based on customer KPIs before deep analysis.
Key results

Faster, more confident solar site selection

Quicker investment decisions can be made based on always-up-to-date site data. No extensive manual work required. 

Less manual collection

Data is aggregated and cleaned instead of copied by hand.

Earlier exclusion of bad sites

KPI filtering removes unsuitable parcels before deeper work.

GIS-ready outputs

Data can be analysed directly in ArcGIS, QGIS, and platforms.
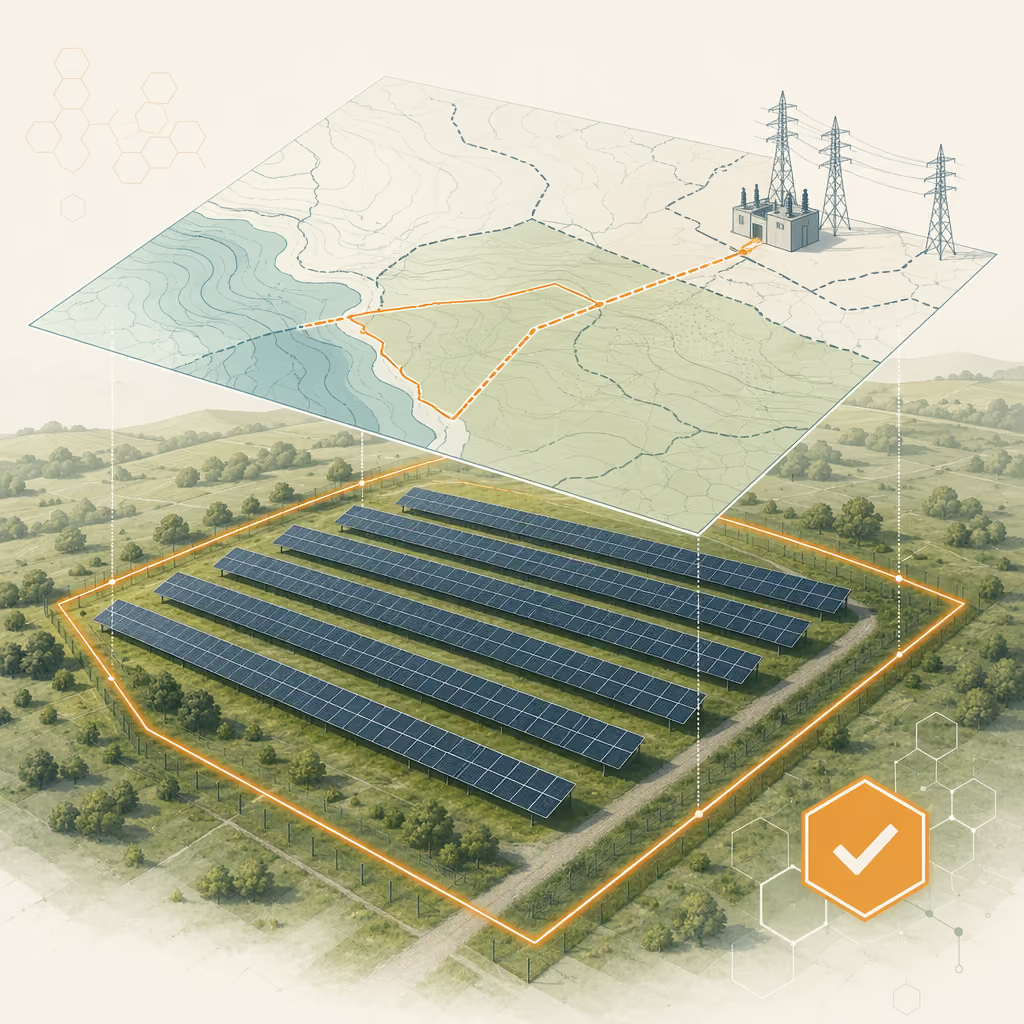
Kartenansicht mit potenziellen Parzellen. Orangefarbene Flächen zeigen Parzellen, blaue Bereiche Wetlands, grüne Linien markieren Feeders, eine markierte Parzelle ist rot umrandet.
How DataHive helps

What DataHive does for you

Unique selling point

Before DataHive

After DataHive

Data collection
Manual / fragmented
Automated / standardized
Data processing
Extra cleaning needed
Filtered by KPIs
Update cycle
Infrequent or delayed updates
Continuous updates
GIS Usage
Many formats to be consolidated
ArcGIS/QGIS-ready
Diagramm eines automatisierten Solar-Standortscreenings von der Datenextraktion bis zur GIS-Visualisierung.
Concrete results

Our approach in action

DataHive turns fragmented geodata into a structured, GIS-ready basis for solar site decisions. Automated extraction, filtering, and analysis reduce manual work, exclude unsuitable parcels earlier, and provide current data directly in the customer’s existing analysis workflow.
Let’s Collaborate

Interested in solar farm investments?

Or screening parcels for other purposes?
Contact us for a non-binding discussion our data services and how we can support you.
Thank you! Your submission has been received!
Oops! Something went wrong while submitting the form.

Frequently Asked Questions

How do you set up solar farm screening based on our KPIs and decision criteria?

How do you assess terrain and site constraints using raster and vector data?

How do you evaluate grid connection feasibility and exclude non-viable sites?

What other types of parcel-level data can you provide?

Are DataHive’s services limited to certain geographies?